【插件資訊】插件來源:
https://dev-cs.ru/r...s/987/使用指令:
1.下載並解壓縮到cstrike資料夾
2.打開cstrike\addons\amxmodx\configs\modules.ini
3.開新行分別加上 : easyprofiler
安裝路徑:如上
【插件介紹】你有沒有在使用某條函數時好奇它的執行速度到底有多快?
雖然現今的電腦設備運行AmxModX根本就輕輕鬆鬆,
但這並不能壓住我們的好奇心,尤其是AMXX模塊有很多相似的功能,
「哪種函數更快」「哪種寫法效率較好」這些疑問不停冒出來

雖AMXX1.10內置了performance monitor,
但顯示的時間並不仔細,而且結果很易受環境影響,

它也不能只測試部分程式碼,使用時要把整個插件加上debug

不過沒辦法,畢竟它本來就不是設計用來測試速度

而這個模塊可以顯示更詳細的執行時間,
你可以從easy_profiler.inc查看可使用的函數:
複製程式
/**
 * Pushes current time in the profiler virtual stack
 *
 * @noreturn
 */
native ep_start();


/**
 * Pops a time from the profiler virtual stack, calculates return value and
 * prints log message accroding to fmt if it was set.
 *
 * @param count         Divisor for time (iterations count)
 * @param fmt           C style format, where "%f" stands for time
 *
 * @return              Elapsed time for `count` operations +-correction value
 */
native Float:ep_end(count = 1, fmt[] = "");


/**
 * Pauses execution
 *
 * @param time         Time in seconds
 *
 * @return             Return value of linux select(...)
 */
native ep_sleep(Float:time);


/**
 * Sets global correction value
 *
 * @param time         Correction value
 *
 * @noreturn
 */
native ep_set_correction(Float:time);


/**
 * Pops a time from the profiler virtual stack, sets correction, calculates return value,
 * prints log message according to fmt if it was set and correction >0.0.
 *
 * @param count         Divisor for time (iterations count)
 * @param fmt           C style format, where "%f" stands for time
 *
 * @return              Correction value
 */
native ep_end_and_set_correction(count = 1, fmt[] = "");


/**
 * Dummy call that returns immediately
 *
 * @noreturn
 */
native ep_dummy_call();


/**
 * Automatically calibrate easyprofiler.
 *
 * @param n         Number of iterations
 *
 * @noreturn
 */
stock ep_calibrate(n = 50000)
{
       ep_start();
       for(new i = 0; i < n; ++i)
       {
              ep_start();
              ep_end();
       }
       ep_end_and_set_correction(n, "Correction is set to %.17f");
}
而這是使用方法:
複製程式
#include <amxmodx>
#include <easy_profiler>

public plugin_init()
{
       ep_calibrate();  //重新校準分析器
       ep_start();
       for (new i = 0; i < 10000; i++)  //重複執行10000次,以獲得較平均的結果
       {
              abs(-114514);   //要測試的函數
       }
       ep_end(1, "abs(-114514) time: %.17f");  //顯示測試後得出的時間
}
將上面的源碼編譯成amxx後放在伺服器上執行就好
測試結果:
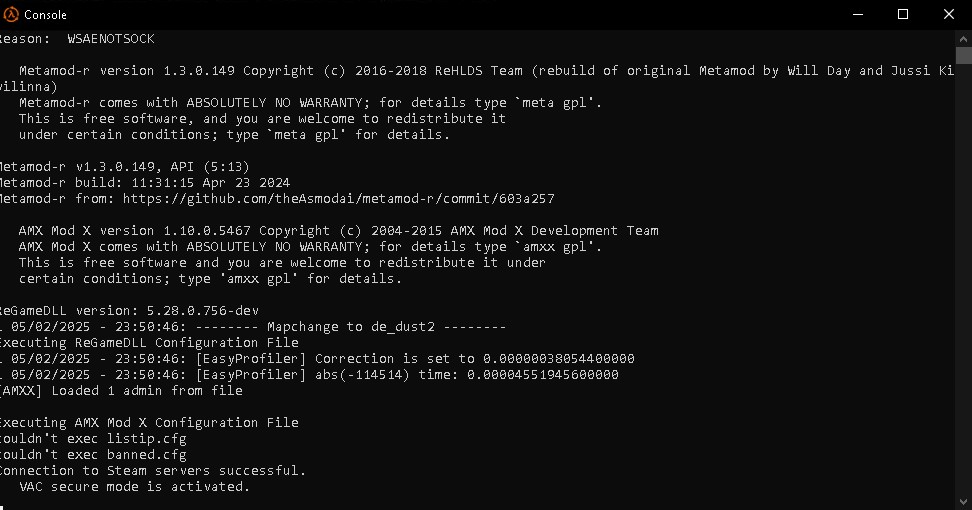
從圖中我們可以看到,
abs(-114514) 這次在這插件執行10000次總消耗時間為0.000045519456秒,
恭喜你,無用的冷知識增加了
不過提醒下各位:
分析器得出的結果有可能因不同環境、不同參數、或其他因素而有所影響,
所以測試結果(尤其是一些差距不太大的數字)大家就只當作一個參考就好


